
Union Tables and Blend Data
Union Tables in Tableau
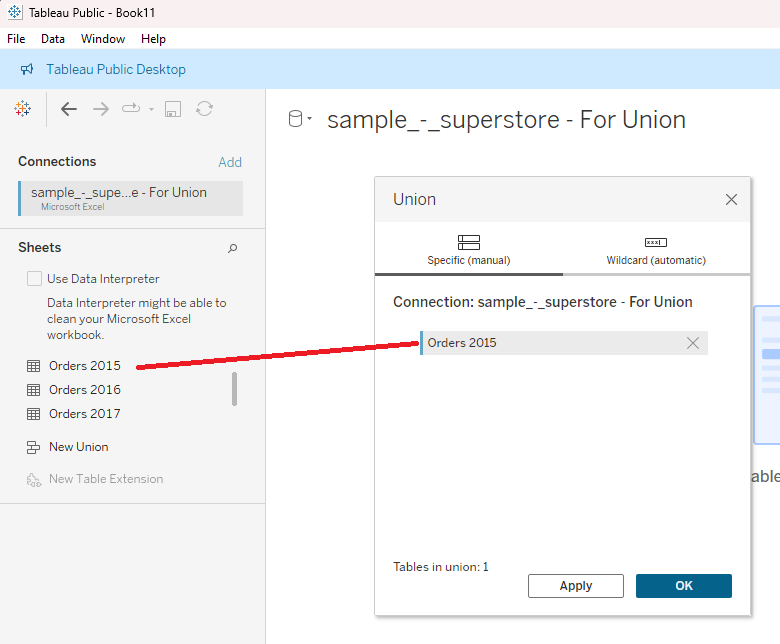
Union data tables manually
To manually union data tables, in the Data Source pane, double-click New Union.

Drag the tables you wish to union from the Data Source pane to the Union dialog box in the canvas.
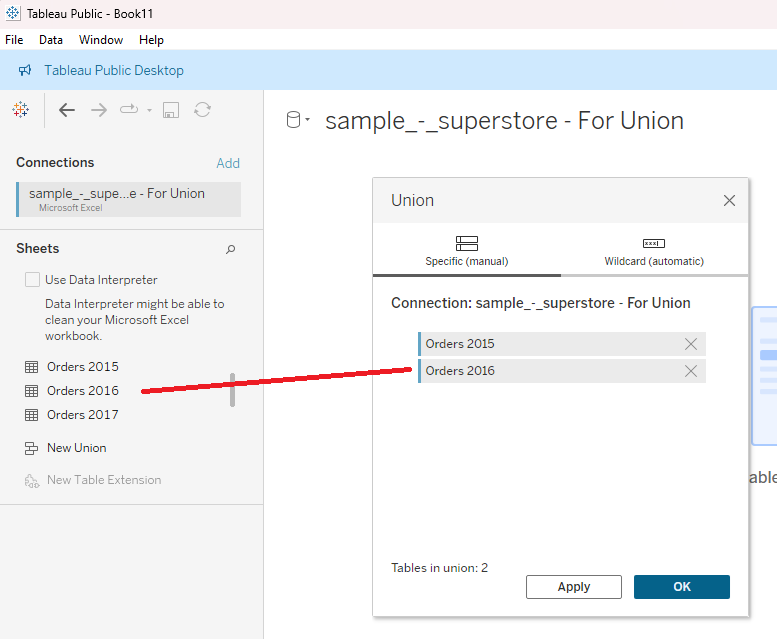
Alternatively, you can use the Shift key or the Ctrl key to select multiple tables and drag them all to the Union dialog box together.
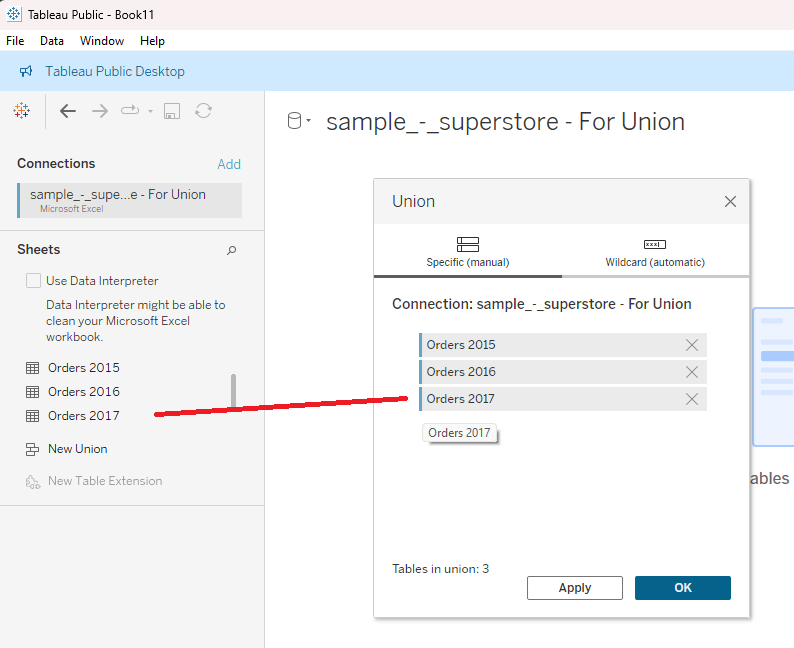
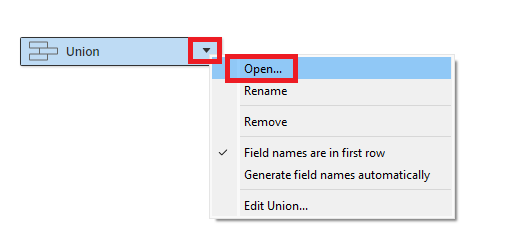
When you have added all the tables you want to union, click OK. The union will be given a default name of Union, but you can rename it after it is created.
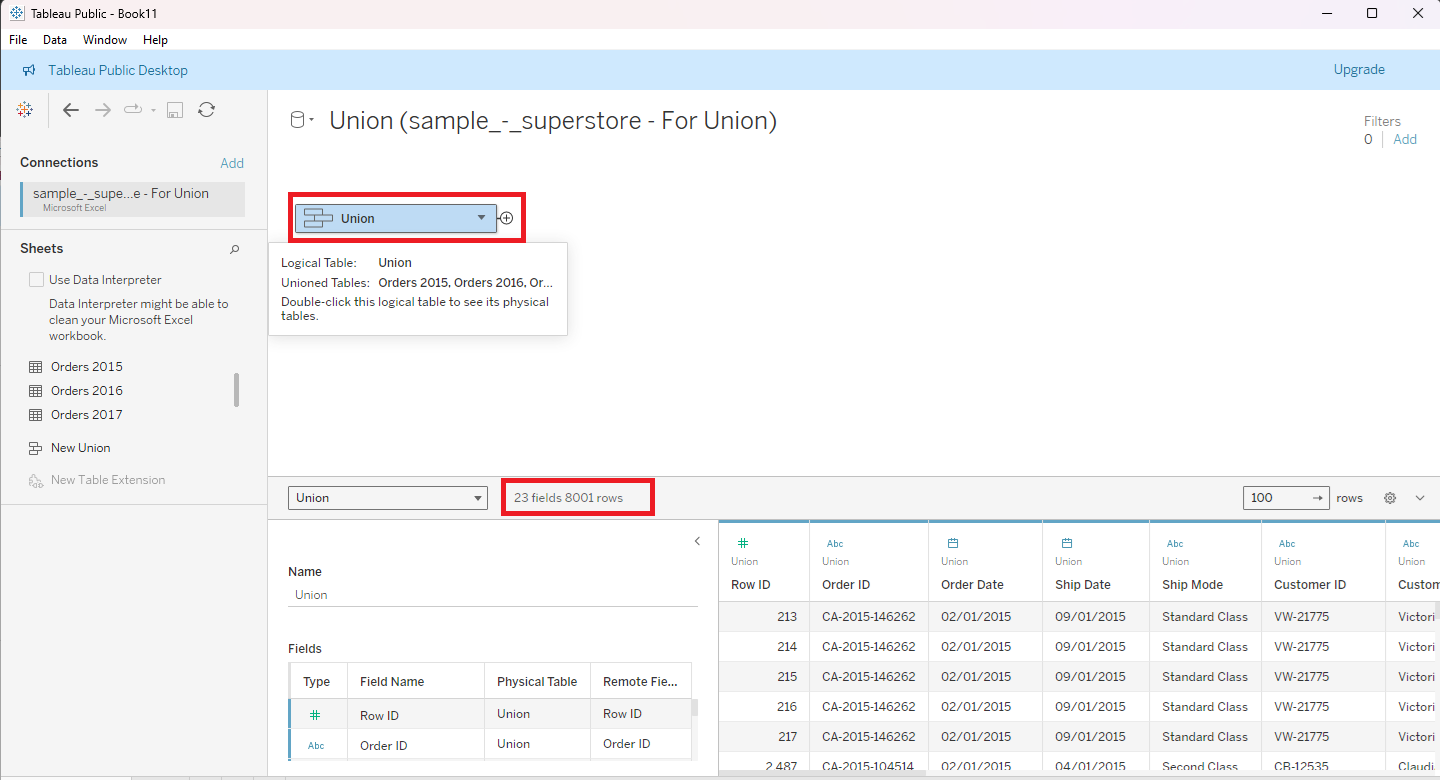
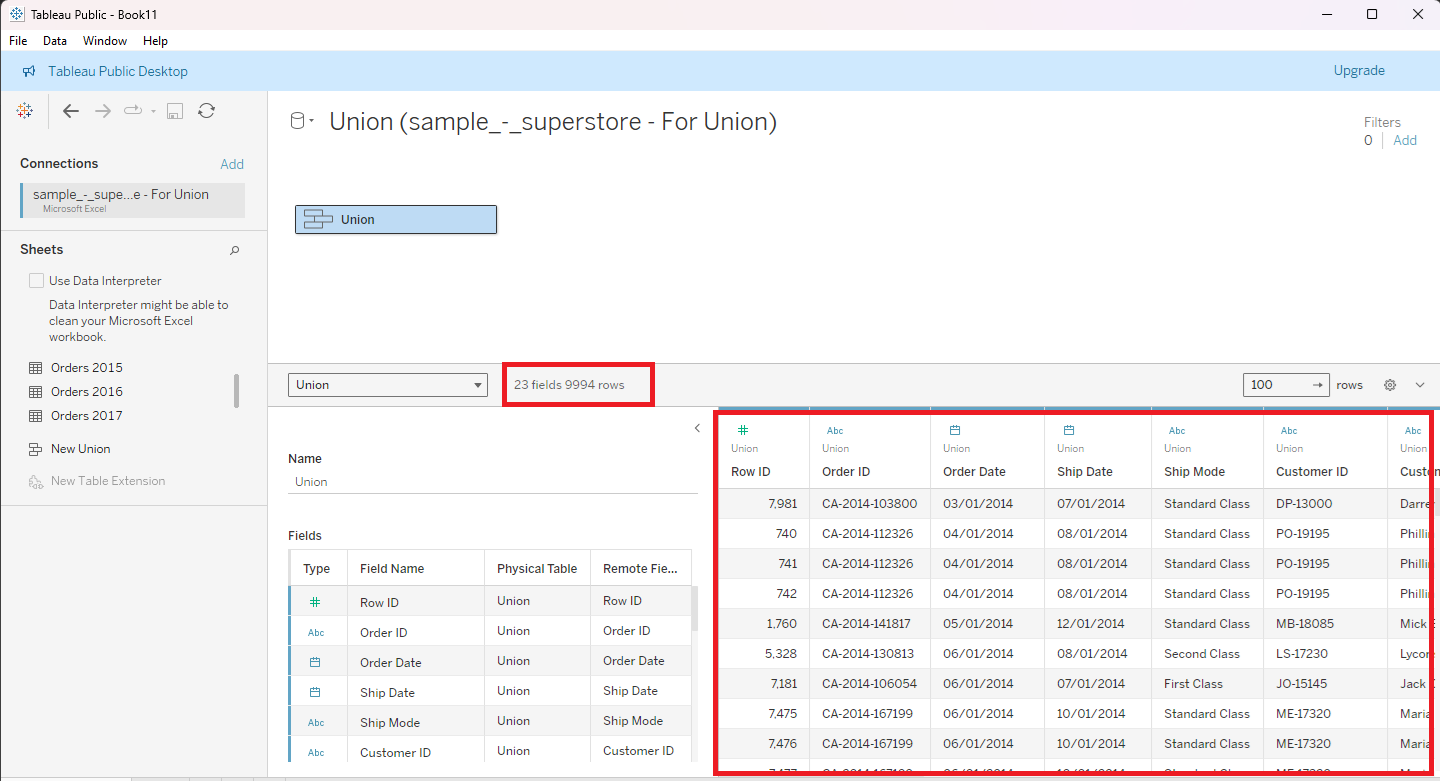
The union will be created, and if you hover over the name of the union, you can see that it is a logical table containing multiple physical tables.
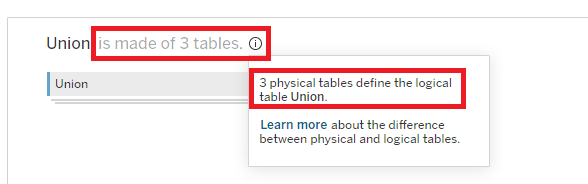
If you open this logical table, it will show that it is made of three physical tables.
Union data tables using wildcard searches
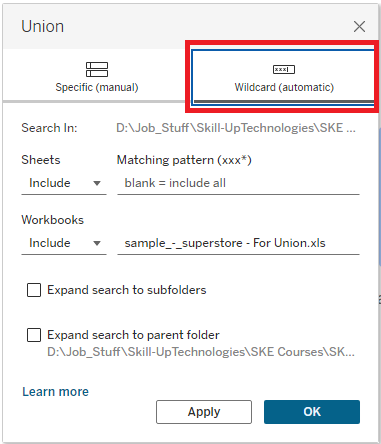
Instead of manually dragging the tables to add to the union, you can also use a wildcard search using the asterisk (*) character. This specified search criterion looks for matching patterns in workbook and worksheet names for Excel and Google Sheets files, text file names, JSON file names, PDF file names, and database table names.
Those items that match the search criteria are then added to the union automatically. By default, the search is limited to the current data connection only.
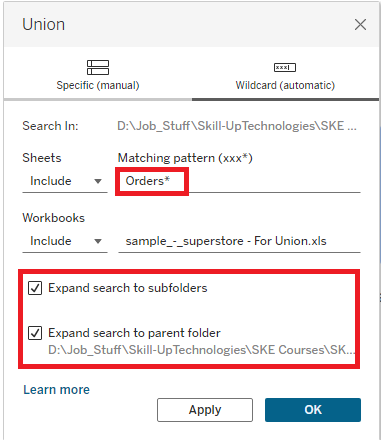
For example, you could search for all tables that have a name that starts with Orders.
Optionally, you can include subfolders and parent folders as part of your search range to include tables that are outside the current folder or are in a different workbook.
The data rows from each of the tables found using the wildcard search criteria will be appended to each other in the unioned table.
Blend Data in Tableau
While unioning tables is about combining data by appending data from multiple tables together that have the same data structure, blending data is all about providing a view of aggregated data from multiple data sources.
With data blending, you first select a primary source, and then add data from a secondary data source to show a blended view of the two pieces of distinct data.
This is most useful when you want to combine data where the linking fields need to vary on a sheet-by-sheet basis or where you want to combine data from already published data sources.
Unlike in a relationship or a join, blended data is never directly combined; rather, each data source is independently queried for the data, and the aggregated results are merged in a blended view.
Blending data
You perform data blending on a sheet-by-sheet basis by using a field from a secondary source in a view in the primary source. The basic steps to blend data are:
- Connect to at least two data sources. Use Data>New Data Source to add the second data source.
- Drag a field from one of the data sources to the view, thus making it the primary data source.
- Switch to the secondary data source and verify it has a blend relationship with the primary data source.
- Drag a field from the secondary data source to the view. Doing this establishes the data blend.
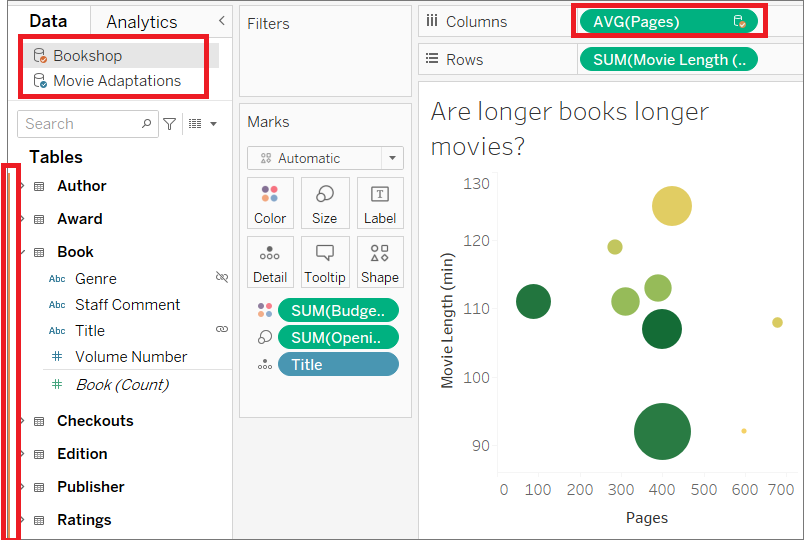
A primary data source is displayed in the Data Source pane with a blue check mark next to it, and the secondary data source has an orange check mark next to it.
Additionally, all the fields from the secondary data source have an orange bar alongside them in the Data pane, and any fields from the secondary data source that are used in the view also have an orange check mark next to their pill in the view.
Further Reading
For more information on blending data in Tableau, read the Blend Your Data article from Tableau Help.
Author(s)
Steve Ryan